Getting a bit of practice with the blogdown workflow
Demo
R Markdown
Author
Mateus Harrington
Published
June 5, 2020
Modified
January 25, 2026
Hello world!
This is my very first blog post using an R Markdown file within blogdown.
The three prior blog posts on this site came with the template, but I’m leaving them there for now as they are great introductory resources for using Academic.
This post (and this whole site!) wouldn’t be possible without the excellent teaching material from Dr. Alison Hill, and the lovely people who made R and her many brilliant packages for which I offer all the gratitude I can muster!
For practice, I’m going to demonstrate how we can include the following in a single post:
R code
A plot
An image (via markdown syntax)
An image (via knitr::include_graphics)
A relative link to another section in my site
Reading in data
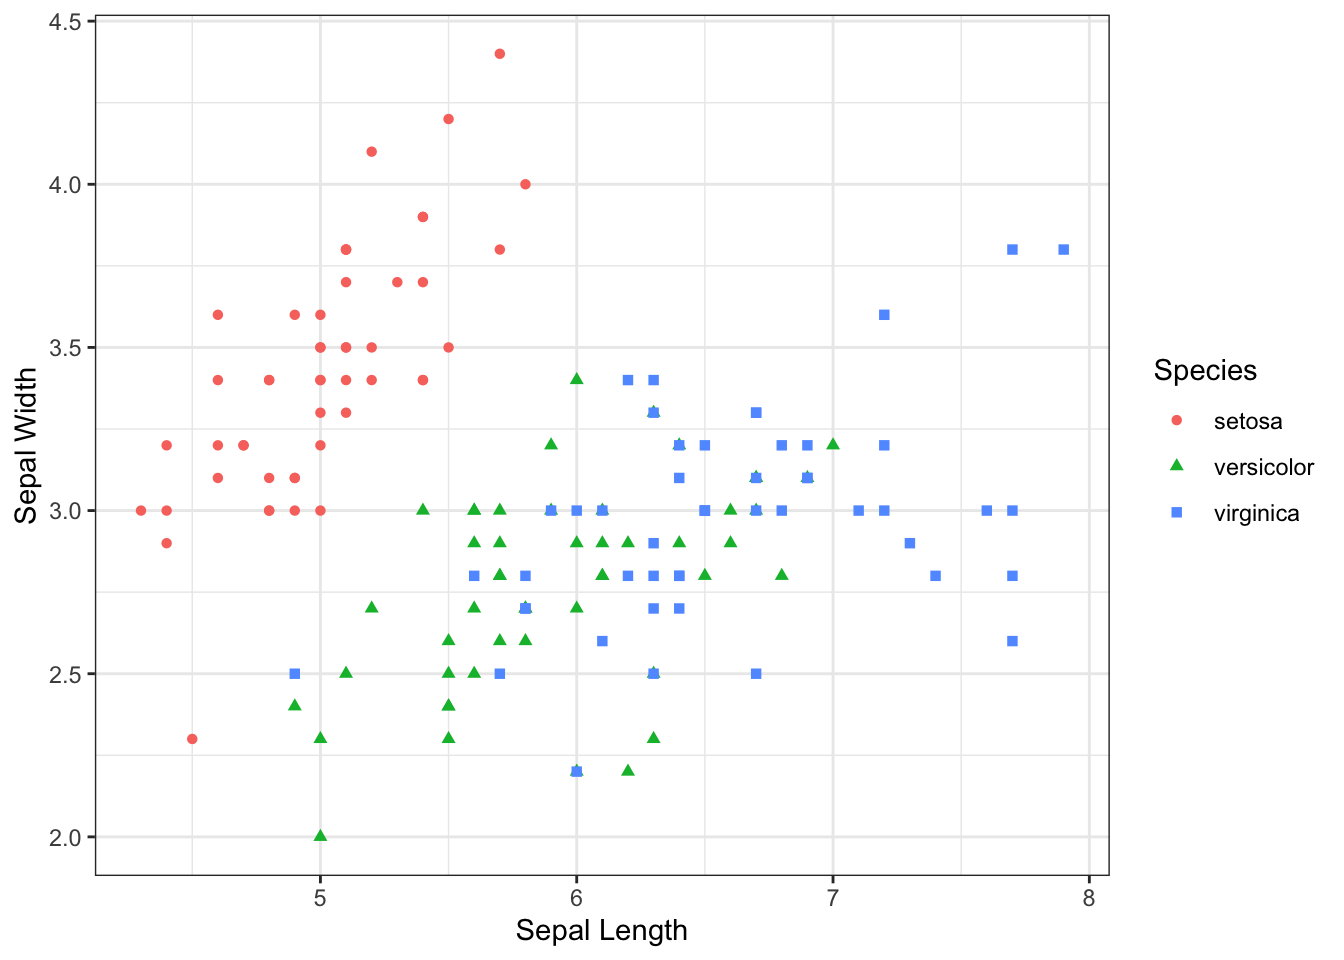
1) Iris data set
Let’s make a plot using the iris data set in ggplot2.
Using markdown syntax  to generate the image below:
Cute red panda
4) Using knitr
We can also accomplish this with a code chunk, setting the following parameter out.width="500px", fig.align='center'
knitr::include_graphics("cute-red-panda-40.jpg")
Figure 1: We can do nice auto-numbered captions as well! Image credit: Unsplash
5) Relative links
I can also include some relative links to, for example, tell you to check out this other section of my site!
The structure of relative links is a bit confusing. When specifying the location of the page you want to get to, the reference point is the directory that your post lives in (and NOT the project root directory).
Note
Now that I’ve migrated my site to use Quarto instead of RMarkdown, the relative links now work how you’d expect, which is very nice!
6) Reading in data
Let’s flex our R muscles a little more by reading in some topical data, and making a fancier plot.
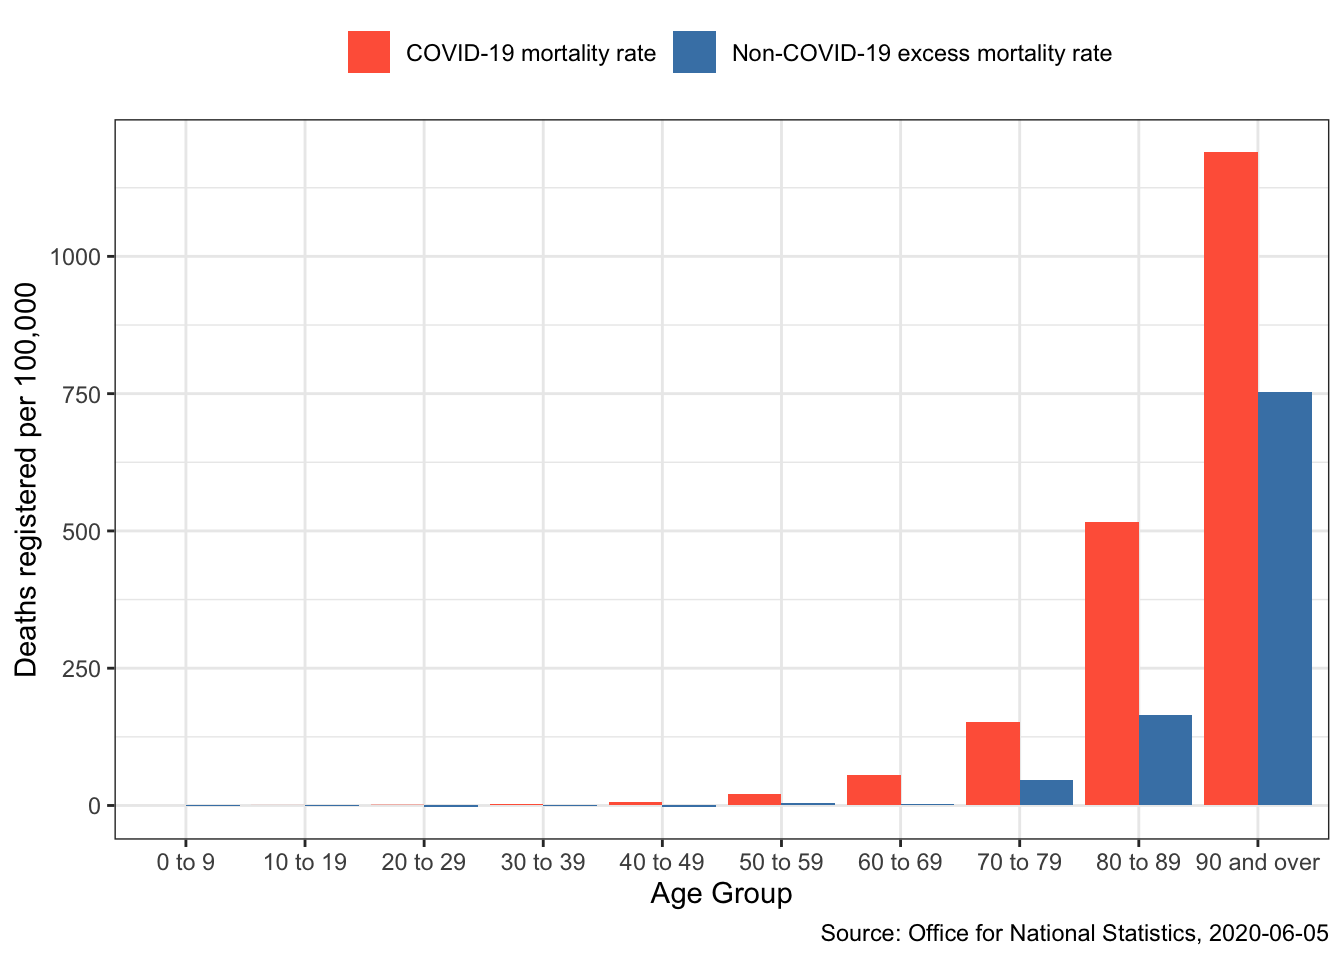
The data is total non-COVID-19 excess deaths per 100,000 and deaths involving COVID-19 per 100,000 for each 10-year age group from England and Wales, Week 11 to Week 18. The numbers around COVID-19 as in constant flux, so please be aware of the date. This data was downloaded from the Office of National Statistics on 2020-06-05.
Toggle the code
library(tidyverse)covid_deaths <-read_csv("covid_deaths_by_age_2020-06-05.csv")# let's select the rows of actual datacovid_deaths_filtered <- covid_deaths[7:16, ]# set column namesnames(covid_deaths_filtered) <-c("age_group","non-covid_excess_mortality","covid_excess_mortality")# convert to long-format dataframecovid_deaths_long <-pivot_longer( covid_deaths_filtered,-age_group,names_to ="mortality_type",values_to ="deaths")# convert deaths to a numericcovid_deaths_long$deaths <-as.numeric(covid_deaths_long$deaths)# plotggplot(covid_deaths_long, aes(x = age_group, y = deaths)) +geom_bar(aes(fill = mortality_type),stat ="identity",position =position_dodge() ) +ylab("Deaths registered per 100,000") +xlab("Age Group") +theme_bw() +theme(legend.position ="top", legend.direction ="horizontal") +scale_fill_manual(name ="",labels =c("COVID-19 mortality rate", "Non-COVID-19 excess mortality rate"),values =c("tomato", "steelblue") ) +labs(caption ="Source: Office for National Statistics, 2020-06-05")
If you’re curious about explanations surrounding the increase in non-COVID-19 related deaths this article lists some theories.
Interestingly, in the age groups up to 50 the non-COVID-19 death rate has declined slightly
The Office for National Statistics estimated the population in the UK to be 66,796,807 in mid-2019. So if we take then high end of 60 lightning strikes, the odds of getting stuck by lightning in the UK is:
Toggle the code
# stop scientific notationoptions(scipen =999)# calculate risk per 100,000risk = (60/66796807) *100000# print resultprint(paste("The incidence rate of lightning strikes per 100,000 = ",round(risk, 5),sep =""))
[1] "The incidence rate of lightning strikes per 100,000 = 0.08982"
So if we assume all humans are equally likely to get stuck by lightning in a given year, then it’s several times more likely for a 0-9 year old to get stuck by lightning than die with COVID-19.
I should stress that this isn’t to make light of COVID-19, many people are dying, and no effort should be spared wherever this can be prevented. If anything, this should highlight how damaging COVID-19 is with a relatively low fatality rate. This pandemic could easily be even worse than it already is with more lethal pathogen behind it, and it is perfectly within the realm of possibility that the next pandemic, which is sadly inevitable, will star a deadlier disease. My greatest hope is that we can use this event as a wakeup call to stop ignoring the scientists who have warned this would happen repeatedly, and prepare better to mitigate future pandemics.
---title: Testing Out Blogdownsubtitle: 'Getting a bit of practice with the blogdown workflow'date: '2020-06-05'date-modified: '2026-01-25'categories: - Demo - R Markdowndescription: ''image: featured.jpeg# image:# caption: 'Image credit: [**Medium**](https://medium.com/@eraylson_/the-hello-world-in-data-science-and-machine-learning-32b85946eb67)'# focal_point: ''# preview_only: no---# Hello world!This is my very first blog post using an R Markdown file within blogdown.The three prior blog posts on this site came with the template, but I'm leaving them there for now as they are great introductory resources for using [Academic](https://sourcethemes.com/academic/).This post (and this whole site!) wouldn't be possible without the excellent teaching material from [Dr. Alison Hill](https://alison.rbind.io/), and the lovely people who made R and her many brilliant packages for which I offer all the gratitude I can muster!For practice, I'm going to demonstrate how we can include the following in a single post:1) R code2) A plot3) An image (via markdown syntax)4) An image (via `knitr::include_graphics`)5) A relative link to another section in my site6) Reading in data# 1) Iris data setLet's make a plot using the `iris` data set in `ggplot2`.```{r}library(ggplot2)# Datasetknitr::kable(head(iris))```# 2) Plotting```{r}scatter <-ggplot(data = iris, aes(x = Sepal.Length, y = Sepal.Width))scatter +geom_point(aes(color = Species, shape = Species)) +xlab("Sepal Length") +ylab("Sepal Width") +theme_bw()```# 3) Embedding a bundled imageUsing markdown syntax `` to generate the image below:{fig-alt="Cute red panda" width=50%}# 4) Using knitrWe can also accomplish this with a code chunk, setting the following parameter `out.width="500px", fig.align='center'````rknitr::include_graphics("cute-red-panda-40.jpg")```<div class="figure" style="text-align: center"><img src="cute-red-panda-40.jpg" alt="We can do nice auto-numbered captions as well! Image credit: Unsplash" width="500px"/><p class="caption">Figure 1: We can do nice auto-numbered captions as well! Image credit: <a href="https://unsplash.com/photos/QZwf5yNopUo"><strong>Unsplash</strong></a></p></div># 5) Relative linksI can also include some relative links to, for example, tell you to check out this [other section of my site](/about)!The structure of relative links is a bit confusing.When specifying the location of the page you want to get to, the reference point is the directory that your post lives in (and NOT the project root directory).::: {.callout-note}Now that I've migrated my site to use Quarto instead of RMarkdown, the relative links now work how you'd expect, which is very nice!:::# 6) Reading in dataLet's flex our R muscles a little more by reading in some topical data, and making a fancier plot.The data is total non-COVID-19 excess deaths per 100,000 and deaths involving COVID-19 per 100,000 for each 10-year age group from England and Wales, Week 11 to Week 18.The numbers around COVID-19 as in constant flux, so please be aware of the date.This data was downloaded from the Office of National Statistics on 2020-06-05.```{r}#| message: falselibrary(tidyverse)covid_deaths <-read_csv("covid_deaths_by_age_2020-06-05.csv")# let's select the rows of actual datacovid_deaths_filtered <- covid_deaths[7:16, ]# set column namesnames(covid_deaths_filtered) <-c("age_group","non-covid_excess_mortality","covid_excess_mortality")# convert to long-format dataframecovid_deaths_long <-pivot_longer( covid_deaths_filtered,-age_group,names_to ="mortality_type",values_to ="deaths")# convert deaths to a numericcovid_deaths_long$deaths <-as.numeric(covid_deaths_long$deaths)# plotggplot(covid_deaths_long, aes(x = age_group, y = deaths)) +geom_bar(aes(fill = mortality_type),stat ="identity",position =position_dodge() ) +ylab("Deaths registered per 100,000") +xlab("Age Group") +theme_bw() +theme(legend.position ="top", legend.direction ="horizontal") +scale_fill_manual(name ="",labels =c("COVID-19 mortality rate", "Non-COVID-19 excess mortality rate"),values =c("tomato", "steelblue") ) +labs(caption ="Source: Office for National Statistics, 2020-06-05")```If you're curious about explanations surrounding the increase in non-COVID-19 related deaths [this article](https://www.ons.gov.uk/peoplepopulationandcommunity/birthsdeathsandmarriages/deaths/articles/analysisofdeathregistrationsnotinvolvingcoronaviruscovid19englandandwales28december2019to1may2020/technicalannex) lists some theories.Interestingly, in the age groups up to 50 the non-COVID-19 death rate has declined slightly```{r}knitr::kable(covid_deaths_filtered)```And for a little context for these numbers, the [Royal Society for the Prevention of Accidents](https://www.rospa.com/leisure-safety/advice/lightning/) reports that 30-60 people are stuck by lightning each year.The [Office for National Statistics](https://www.ons.gov.uk/peoplepopulationandcommunity/populationandmigration/populationestimates/bulletins/annualmidyearpopulationestimates/mid2019) estimated the population in the UK to be 66,796,807 in mid-2019.So if we take then high end of 60 lightning strikes, the odds of getting stuck by lightning in the UK is:```{r}# stop scientific notationoptions(scipen =999)# calculate risk per 100,000risk = (60/66796807) *100000# print resultprint(paste("The incidence rate of lightning strikes per 100,000 = ",round(risk, 5),sep =""))```So if we assume all humans are equally likely to get stuck by lightning in a given year, then it's several times more likely for a 0-9 year old to get stuck by lightning than die with COVID-19.I should stress that this isn't to make light of COVID-19, many people are dying, and no effort should be spared wherever this can be prevented.If anything, this should highlight how damaging COVID-19 is with a relatively low fatality rate.This pandemic could easily be even worse than it already is with more lethal pathogen behind it, and it is perfectly within the realm of possibility that the next pandemic, which is sadly inevitable, will star a deadlier disease.My greatest hope is that we can use this event as a wakeup call to stop ignoring the scientists who have warned this would happen repeatedly, and prepare better to mitigate future pandemics.