Finally, Grafana (Part 4)
This is part 4 of a four-part series. Index · Part 1 (cluster) · Part 2 (Flux + SOPS) · Part 3 (Tailscale).
By the time I got to this part, the hard work was done. The whole “deploy Grafana” thing took an evening and most of that was me reading documentation for fun. The hard bits were everything I had to put in place before this. That’s the recurring lesson of this whole series, the visible step (a dashboard at a nice URL) is the tip of a fairly tall iceberg.
The Helm release
I’m using kube-prometheus-stack, the prometheus-community chart that bundles Prometheus, Grafana, Alertmanager, the operator, and a sensible set of default dashboards and rules in one go. The Helm release looks like this:
apiVersion: helm.toolkit.fluxcd.io/v2
kind: HelmRelease
metadata:
  name: kube-prometheus-stack
  namespace: monitoring
spec:
  interval: 30m
  chart:
    spec:
      chart: kube-prometheus-stack
      version: ">=85.0.0 <86.0.0"   # Patch releases auto; minor bumps manual
      sourceRef:
        kind: HelmRepository
        name: prometheus-community
        namespace: flux-system
      interval: 24h
  install:    { crds: Create,        remediation: { retries: 3 } }
  upgrade:    { crds: CreateReplace, remediation: { retries: 3 } }
  values:
    grafana:
      admin:
        existingSecret: grafana-admin-secret  # SOPS-encrypted
        userKey: adminUser
        passwordKey: adminPassword
      ingress: { enabled: false }   # Handled separately, below
      persistence:
        enabled: true
        storageClassName: truenas-nfs
        size: 5Gi
    prometheus:
      prometheusSpec:
        retention: 30d
        retentionSize: "45GiB"
        storageSpec:
          volumeClaimTemplate:
            spec:
              storageClassName: truenas-nfs
              accessModes: ["ReadWriteOnce"]
              resources: { requests: { storage: 50Gi } }
        # Discover ServiceMonitors / PodMonitors in ALL namespaces
        serviceMonitorSelectorNilUsesHelmValues: false
        podMonitorSelectorNilUsesHelmValues: false
        ruleSelectorNilUsesHelmValues: false
        probeSelectorNilUsesHelmValues: false
    alertmanager:
      alertmanagerSpec:
        storage:
          volumeClaimTemplate:
            spec:
              storageClassName: truenas-nfs
              accessModes: ["ReadWriteOnce"]
              resources: { requests: { storage: 1Gi } }
There are three deliberate choices in there worth calling out.
Version pin as a range. >=85.0.0 <86.0.0 lets patch releases flow through automatically, I want bug fixes without having to think about them, but stops minor bumps. Minor versions of kube-prometheus-stack have a habit of renaming values, and I’d rather find out about that on a Saturday than at 11pm.
...SelectorNilUsesHelmValues: false. This is the most useful of the four lines in that block. By default Prometheus only discovers ServiceMonitor / PodMonitor resources that match the Helm release’s own label selector. Setting these to false makes Prometheus pick up any ServiceMonitor in any namespace. That means future apps can ship their own ServiceMonitor next to their Deployment and they’ll be scraped automatically, with no changes to this file. Future-me will appreciate that future-me does not need to remember to touch this file every time future-me adds a new workload.
Storage on NFS via democratic-csi. This is where the work in Part 3 pays off. Grafana, Prometheus, and Alertmanager all get their PVCs from the truenas-nfs StorageClass, which means dashboards and metrics survive any pod restart, any node reboot, and any cluster rebuild (as long as the PVs stay around). The Retain reclaim policy on that StorageClass also means a typo’d kubectl delete pvc won’t silently take 30 days of metrics with it.
The Tailscale Ingress
The kube-prometheus-stack chart can manage its own Grafana Ingress, but I wanted to use the Tailscale Kubernetes Operator to expose it as its own Tailnet device. So I disabled the chart’s ingress and added one of my own:
# kubernetes/apps/monitoring/grafana-ingress.yaml
apiVersion: networking.k8s.io/v1
kind: Ingress
metadata:
  name: grafana
  namespace: monitoring
spec:
  ingressClassName: tailscale
  rules:
    - http:
        paths:
          - path: /
            pathType: Prefix
            backend:
              service:
                name: kube-prometheus-stack-grafana
                port: { number: 80 }
  tls:
    - hosts: [grafana]
The Tailscale operator picks this up, provisions a Tailnet device called grafana (tagged tag:k8s thanks to the operator config), and routes HTTPS traffic from that device to the Grafana Service on port 80. From my laptop I open https://grafana.<tailnet>.ts.net and I’m in.
The thing I like most about this is that there’s no DNS rewrite, no SWAG config, no Let’s Encrypt cert renewal to worry about. MagicDNS handles the name. Tailscale handles the TLS. The operator handles everything in between. If I want to expose Alertmanager too later, it’s another six-line YAML file and nothing else changes.
Secrets, the boring way
The Grafana admin password lives in grafana-admin-secret.sops.yaml, encrypted at rest with SOPS + age (see Part 2). The HelmRelease references it via existingSecret, so the password never appears in any Flux manifest in plaintext. Adding a new secret to a workload follows exactly the same pattern as any other secret in the cluster, and that consistency is, again, the entire point.
The actual reward
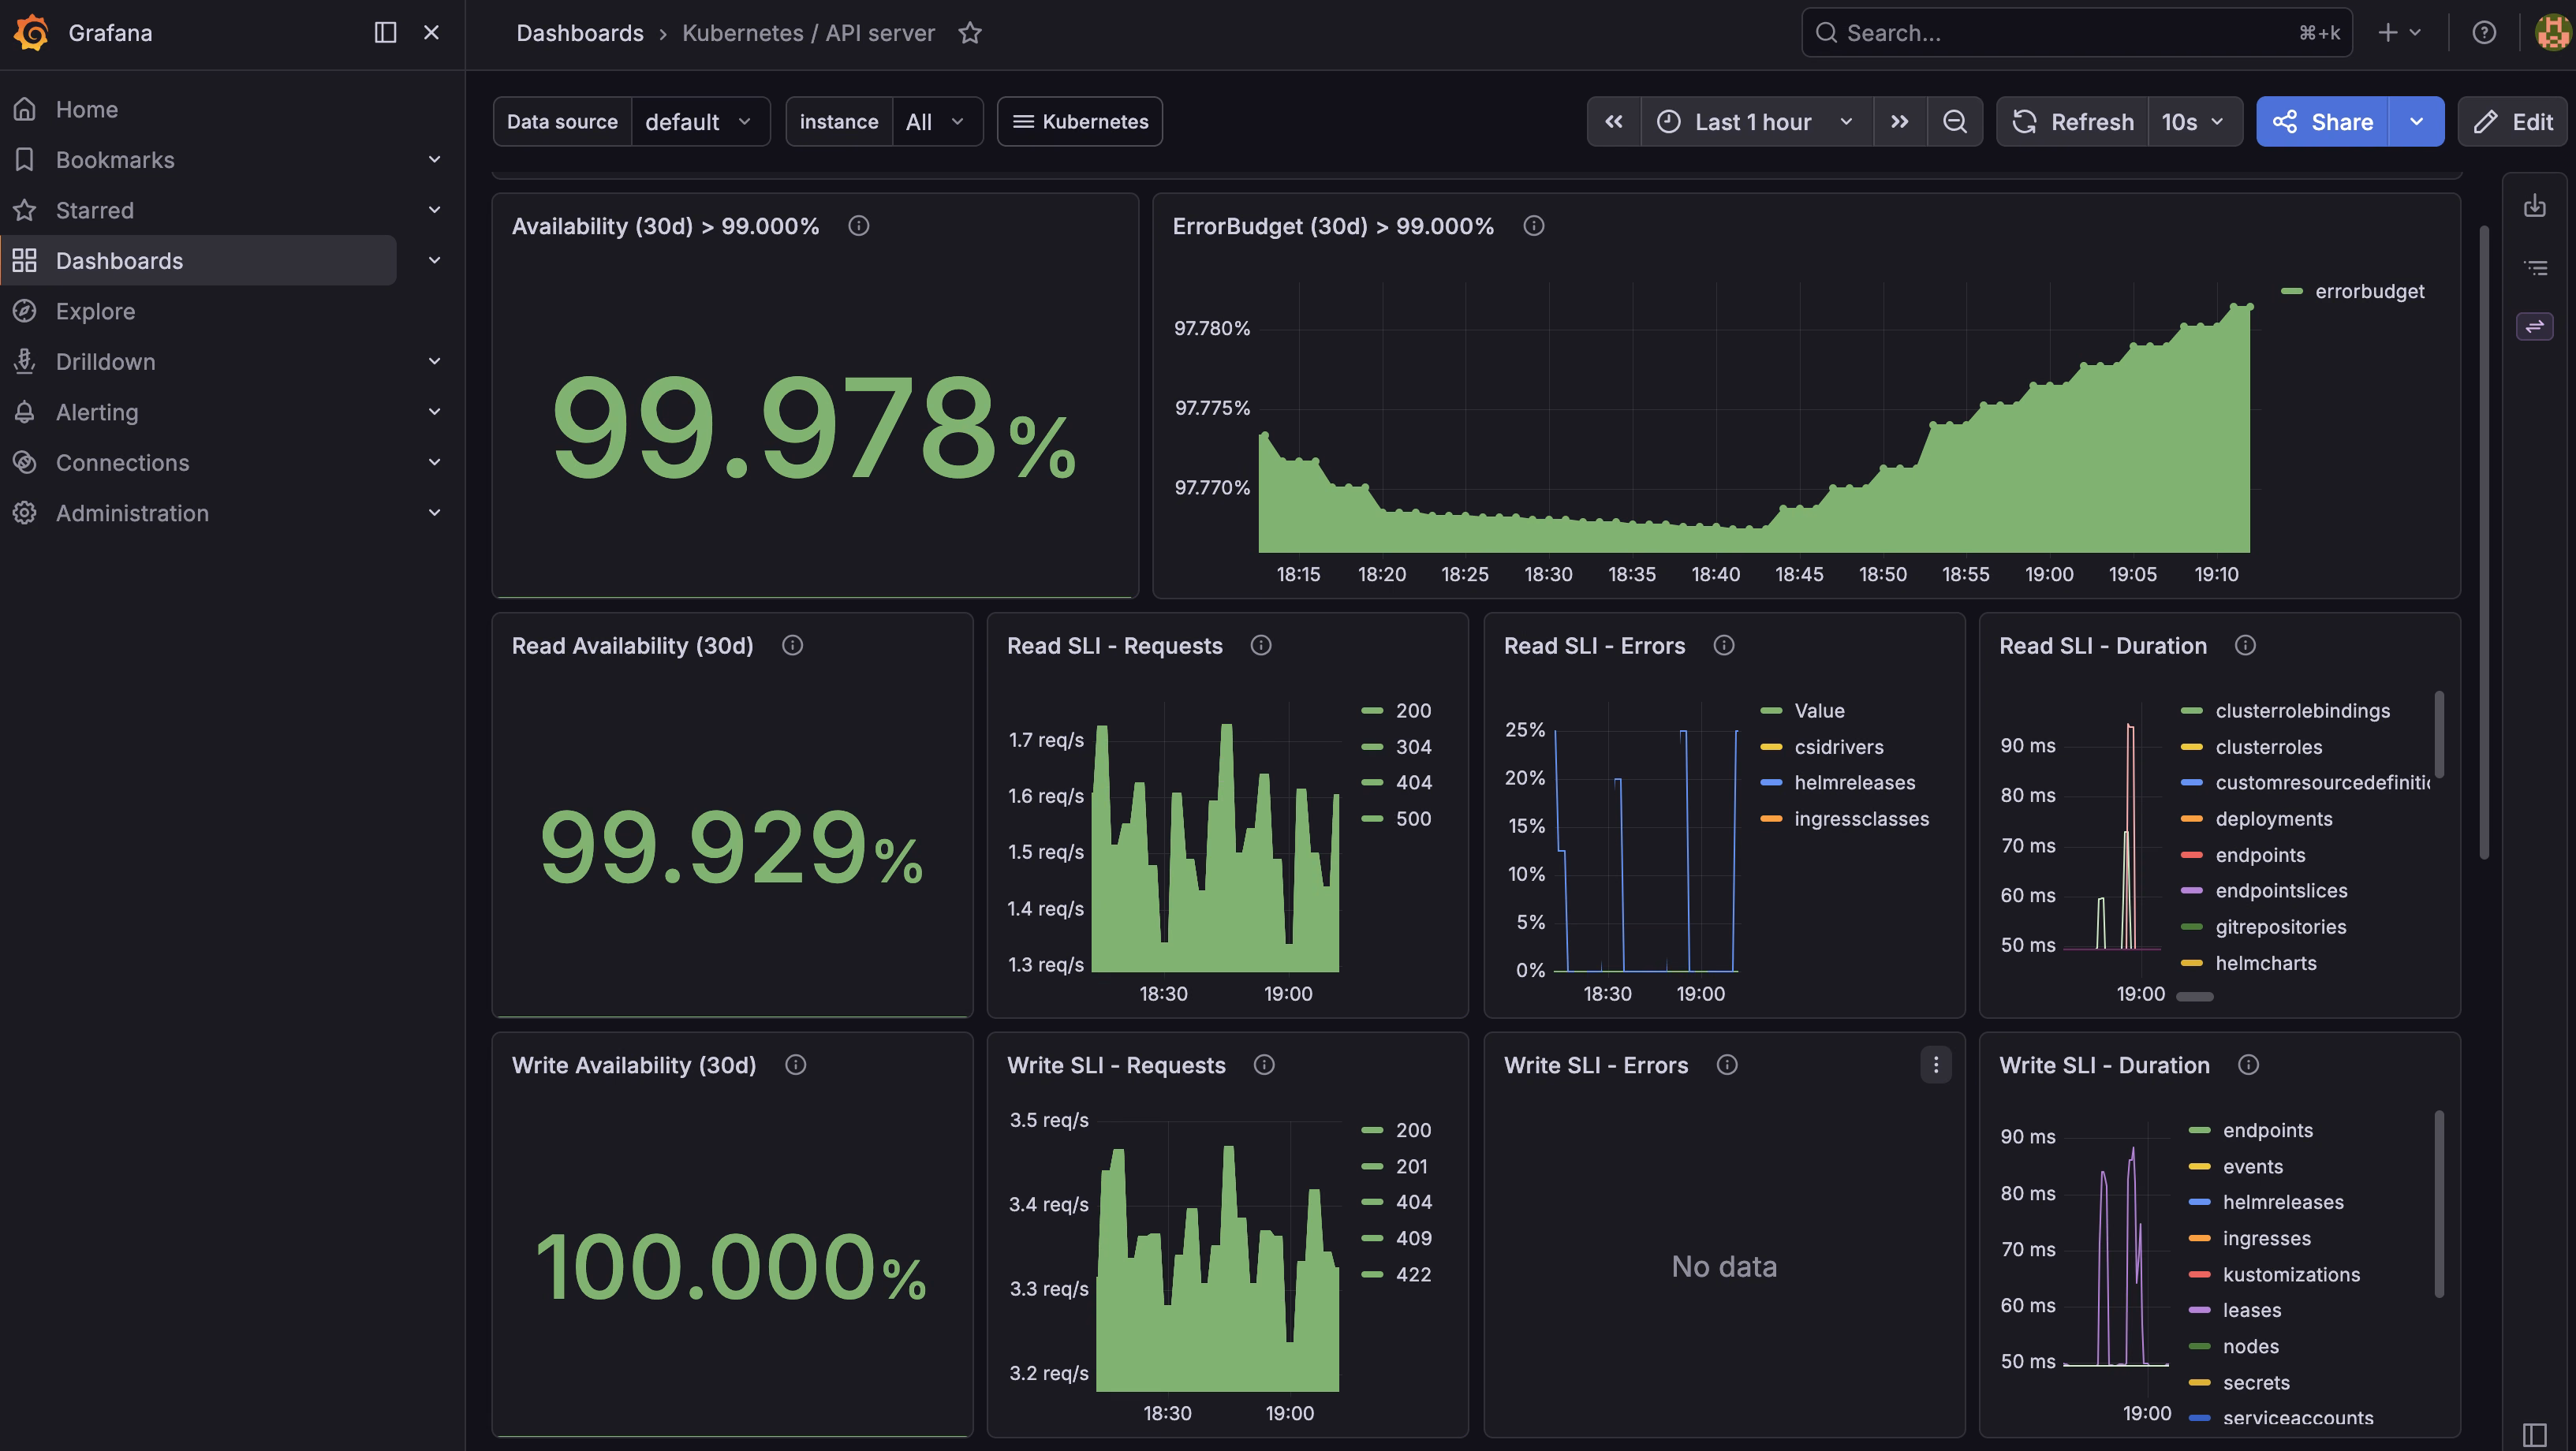
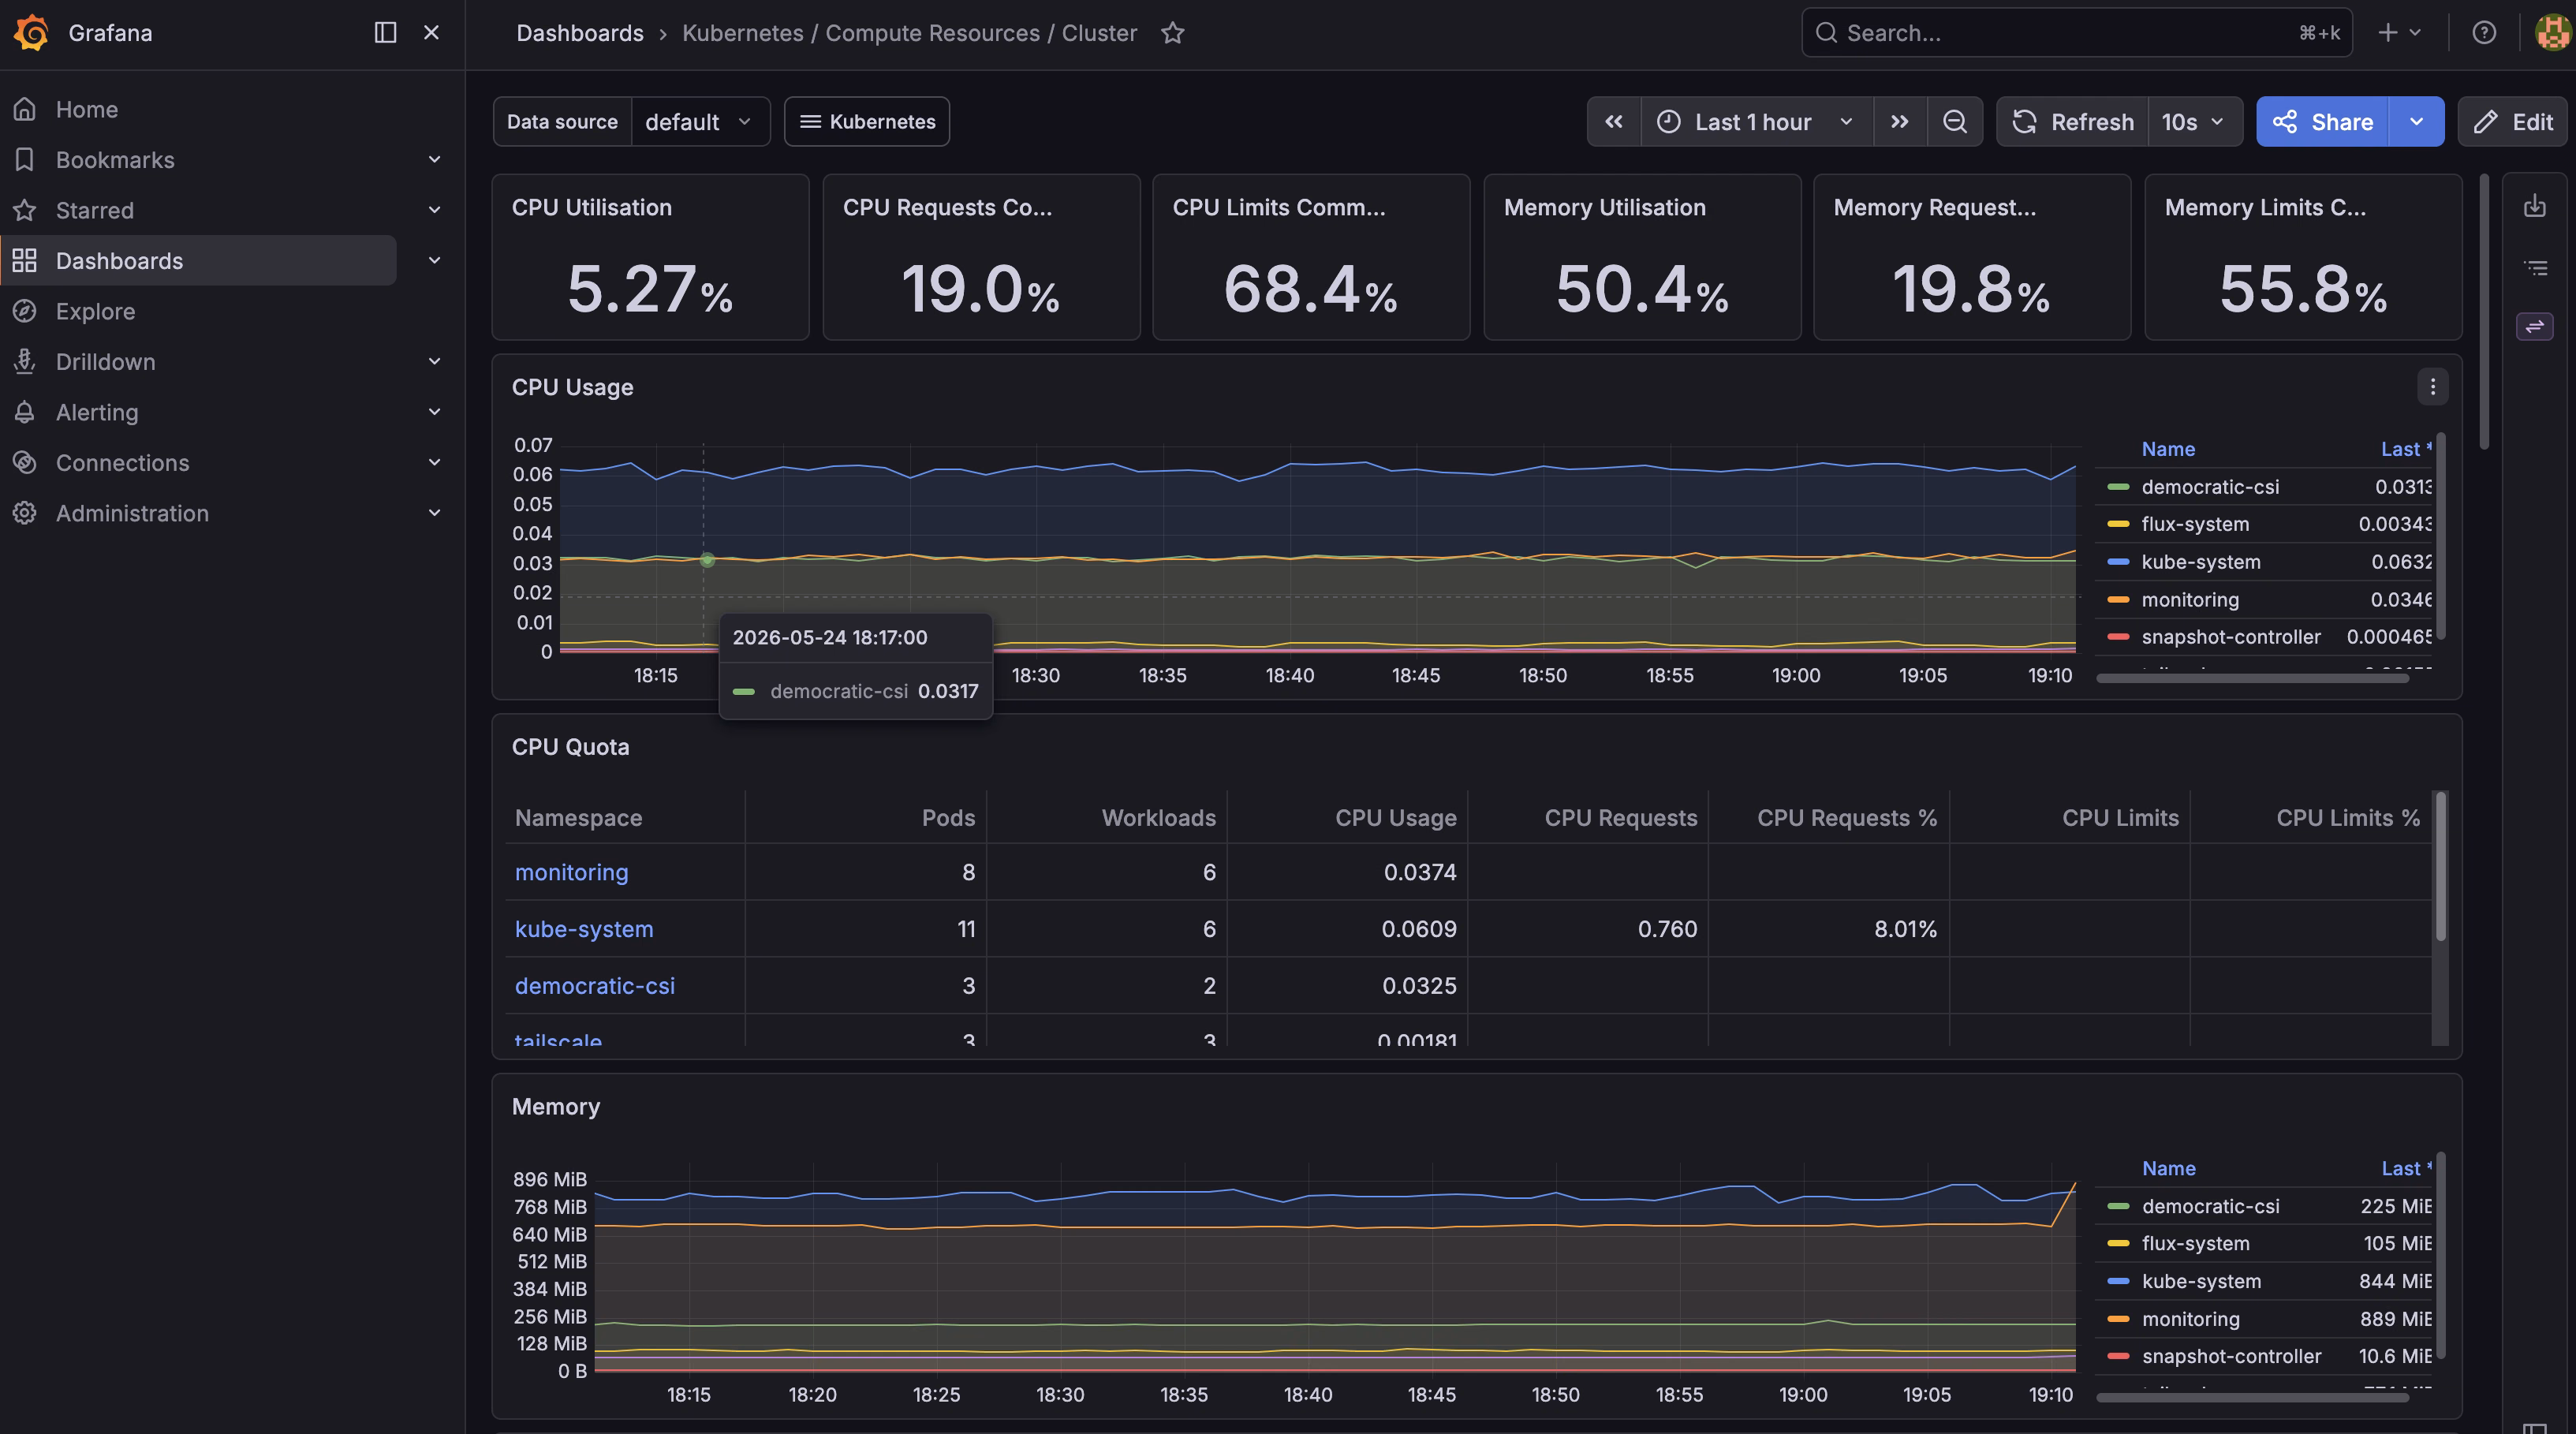
That’s it. Out of the box you get:
- Cluster-level dashboards (CPU, memory, network, by node and by pod).
- A handful of well-built Kubernetes-internal dashboards (apiserver, kubelet, scheduler, etc).
- Default alerting rules for things like “node is unreachable” or “PVC is filling up”.
It’s the kind of monitoring you’d pay a SaaS for at work, running on a Mini PC in a closet, defined entirely in the same git repo as the rest of the homelab.
What’s next
The repo’s README.md has the full backlog, but the things at the top of it are:
- Add Renovate Bot so HelmRelease / chart versions update automatically (with a PR I can review) rather than via me occasionally running
helm search repo ... --versions. - Get a Home Assistant stack onto the cluster.
- Replace the snapshot-of-snapshots backup strategy with a real 3-2-1 setup (restic → Backblaze B2).
- Set up Alertmanager notifications to something I actually read. Probably a Telegram bot.
- Connect my TrueNAS server and docker services with Grafana, probably via cAdvisor + Node Exporter
- Setup Paperless-ngx as a test of iSCSI
- Setup my Talos cluster to deploy via OpenTofu
A short reflection
The thing nobody warns you about with homelabs is that the operational maturity creeps up on you. There was no single moment where I “graduated” from running Docker Compose by hand to running a real GitOps platform with encrypted secrets, dynamic storage, monitoring, and a sane network model. It happened one weekend evening at a time, over months.
If you’re at the start of that, the advice I’d give myself is: don’t try to do all of it before you do any of it. Get the cluster up. Get one workload deployed via Flux. Move on. The Tailscale tag rework, the SOPS hook, the democratic-csi-controller egress trick, the Immich migration — all of those are things I’d have happily done as one-evening side quests if I’d known they were one-evening side quests. They only feel insurmountable when you try to plan them all at once.
Future-me, if you’re reading this because Grafana is broken again: it’s probably the truenas-nfs PVC. Or the operator forgot to provision the Ingress device. Or you renamed something in the ACL. Good luck.